NEXPOM 2i

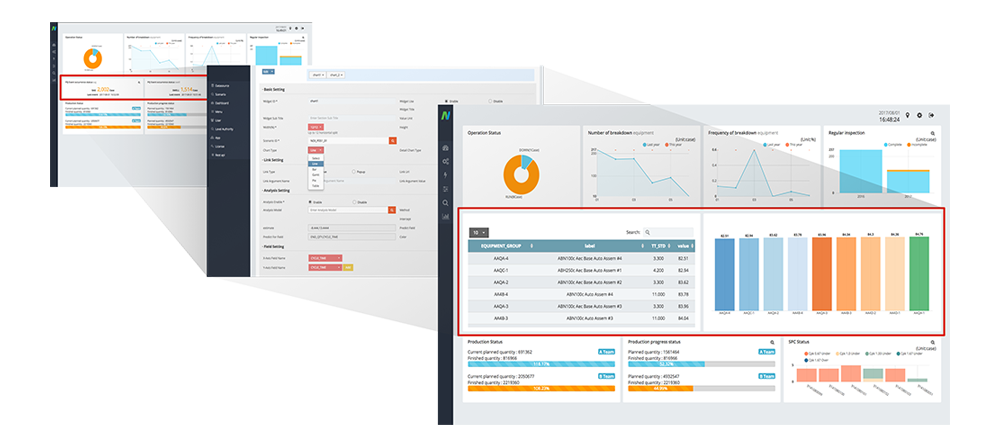
Deriving meaningful insight from
that data and converting knowledge into action!

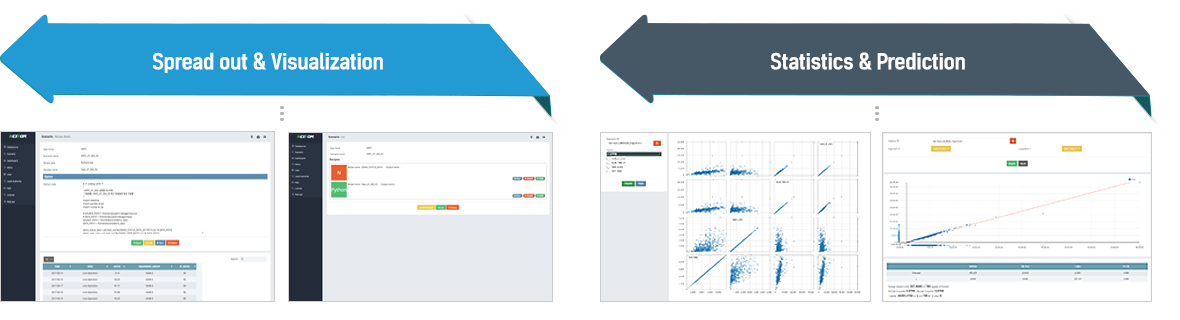
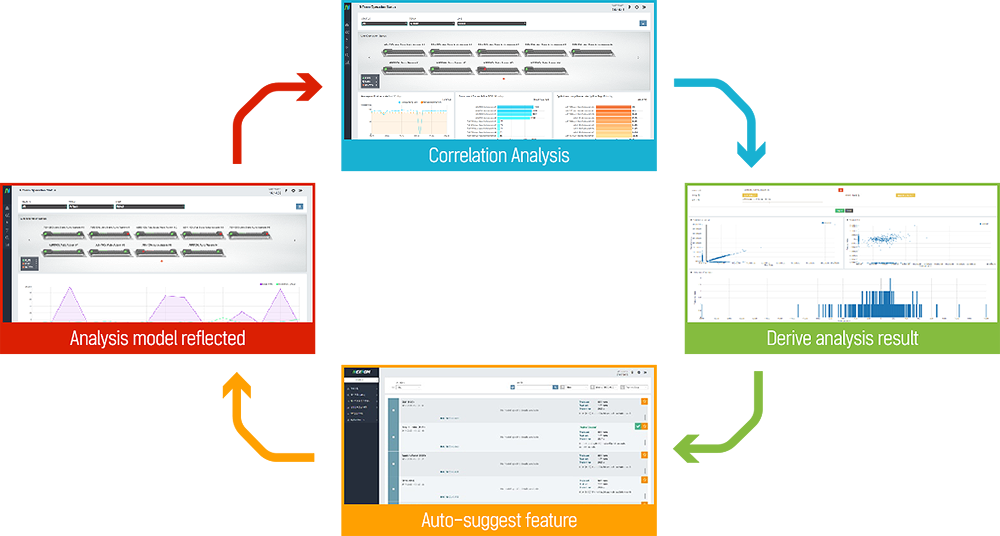
User Interface support that can be performed by customers’ cycle of
‘Manufacturing Data Collection -> Analysis -> Reflection of Results -> Verification’ Platform.

Smart Editor

Smart Editor allows you to create and edit your own KPI scenarios and dashboards
from the collected data, without need to spend any extra cost!

  1.  You can easily modify and visualize your own dashboards
  2.  Panel type configuration makes it easy for users
  3.  Various chart types available (Line, Bar, Pie, Table, etc.)
  4.  Over 250 basic KPI scenarios are available to perfectly match individual manufacturing environment
  5.  Provides Connectivity to text-based (CVS, Jason, XML, etc.), Excel, DBMS and various data sources (Hadoop, Rest API-Cloud DB, Store, No SQL)

Smart Analysis

Smart Analysis is the tool to work through a machine learning project
end-to-end and cover the key steps to analysis and visualize the status real-time

  1. Analytics Experts can use this tool to turn simple data into actionable insights.
  2. Provides Recipe Support on various scenarios (Python, R, MSSQL, My SQL, etc.)
  3. Provides various analysis algorithms (Regression, Decision Tree, Predict Analytics)
  4. Easy to use machine learning model and external library
  5. Validate data models by using various algorithms
  6. Data can be easily visualized through optimized models and recommended models
  7. Easy to use Drag & Drop based data analysis